Velocity-Time Graph
Take time on the horizontal axis and velocity on the vertical axis on a graph paper. Let one division on horizontal axis represent 1 s and one division on vertical axis represent 10 ms–1.
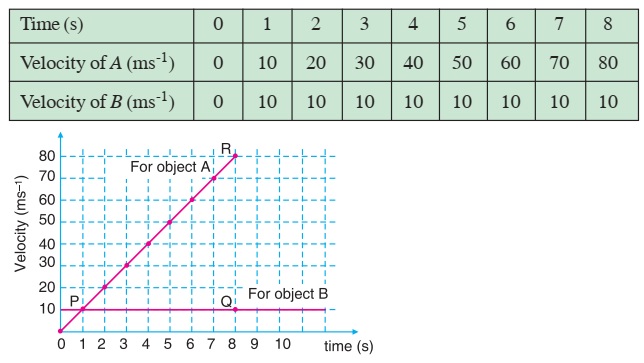
Lines OR and PQ represent the motion of object A and B respectively. The velocity-time graph of motion is a straight line and parallel to time axis for object B. This is so because the velocity is constant throughout the motion. The motion is uniform. Consider the area under the graph for object B.
Area = (8 s) × (10 ms–1) = 80 m. This is equal to the displacement of the object B in 8 s.
Area under velocity-time graph = Displacement of the object during that time interval
For object A area under the graph,
= 1/2 (8 s) (80 - 0) ms–1
= 320 m
This is equal to the displacement of object A in 8 s.